February 17, 2025 · Alex Badiu
Automated Documentation with INFO VIEW Functions in Power BI
Introduction
Microsoft introduced in October 2024 INFO.VIEW Data Analysis Expressions (DAX) functions to get metadata about your semantic model. There are 4 functions that can be used in calculated tables of the semantic model as well as in DAX Query View. Adding them as calculated tables ensures your model self-documents and stays current with all your latest changes automatically.
Source: INFO VIEW Function Intro
Automated Documentation
Power BI’s INFO DAX Functions such as INFO.VIEW.MEASURES(), INFO.VIEW.TABLES(), INFO.VIEW.COLUMNS(), and INFO.VIEW.RELATIONSHIPS() are important for anyone who wants an always up-to-date, self-documenting semantic model. Instead of switching through the different views on Power BI (Report View and Model View) to figure out what’s in your data model, these functions give you a clean, tabular overview that can be queried, displayed, and filtered for deeper analysis easily.
Do we qualify this feature as a game changer enhancement?
Well, without integrating these tables into specific processes, and knowing how to act upon them, the answer is NO. Documentation alone has no value. What matters is having a clear purpose, a structured process, and the right people reviewing the documentation at the right time.
The INFO functions can bring a lot of value if they are integrated in code reviews or optimization exercises. They help spot important information in seconds. Here’s how:
1. INFO.VIEW.MEASURES(): Documenting Measures at Scale
A one-stop shop for describing all the measures in your model (e.g., where they are, their name, data type, expression, state, format, etc.) is exactly what INFO.VIEW.MEASURES() provides.

Why It’s Powerful
- Always current: The table will update on each semantic model refresh and show all added or updated measures.
- Single-Screen Overview: No more switching between tables to verify measure placement or naming consistency, you can see it all in one table screen.
- Validation & Best Practices: Quickly identify measures in error, confirm standardized naming conventions, or check if you’re using consistent formatting (e.g., currency, percentage, etc.).
Check the following DAX Best Practices for Measures
- Consistent Naming: Adopt clear, concise naming conventions (e.g.,
Sales Total,Margin %, etc.). - Use Variables:
VARstatements simplify your code, increase clarity (and readability), and reduce number of evaluations. - Proper Data Type: Ensure measures display the correct currency, percentage, or decimal precision.
- Minimize Nested IFs: Replace multiple IF statements with more efficient alternatives like SWITCH or COALESCE.
- Dedicated Measure Table: Keep your measures organized in one table or folder for easy navigation.
- Validate Performance: Regularly assess complex measures, especially in large datasets, to prevent performance bottlenecks.
- Document with Annotations: Add descriptions to clarify each measure’s purpose and logic.
[!TIP] Temporarily store new measures in a dedicated folder (e.g., “WorkInProgress” or prefix
_Temp) until they’re finalized. This helps your team track which measures still need review or optimization.
[!TIP] For complex DAX, focus on WHY the code is written that way, not just what it does - Copilot, ChatGPT or other LLM can explain that easily. The real value lies in documenting the reasoning and decisions behind the approach.
2. INFO.VIEW.TABLES(): A Snapshot of Your Data Model
While INFO.VIEW.MEASURES() provides information on measures, INFO.VIEW.TABLES() gives you an at-a-glance look at each table’s properties. You can quickly see the storage mode (Import, DirectQuery, Direct Lake) and check if you’ve designated a table with Data Category as Time (a vital step for every Power Bi report is to have a date table and mark it as a date table).

Key Benefits
- Storage Mode Insights: Identify potential performance or refresh issues if the model mixes Import and DirectQuery.
- Date Table Verification: Confirm that you have a proper date table (i.e., there are no tables with the “LocalDateTable_” prefix
- Easy Governance: Spot tables that might be underutilized or incorrectly labeled.
[!WARNING]
💡INFO.VIEW.TABLES()can be used to identify the storage mode of a table. Note that, even if a specific table appears as Direct Lake, it does not mean the queries will be in Direct Lake mode. When developing the model, you must test the queries using DAX Studio or Performance Analyzer to determine whether the query is in Direct Lake or DirectQuery mode Controlling Direct Lake Fallback Behavior
[!TIP] Enrich Your Supporting Tables with Detailed Descriptions
For supporting tables, adding detailed descriptions can significantly improve understanding and maintainability. Here’s how to improve your documentation:
- Information descriptions: Add clear descriptions that explain each supporting table’s purpose. Detail why the table exists, what kind of data it holds and what role it plays.
- AI-Enhanced Descriptions: Utilize AI tools to automatically generate or enrich these annotations as a starting point. For example, you can have AI summarize the most important steps performed in Power Query, such as filtering, merging, or pivoting.
- Documenting transformations and design decisions: Clearly state why you chose to normalize or denormalize certain tables. Include the rationale behind these decisions (e.g., performance optimization, simplicity of data structure, ease of maintenance, specific visualizations, etc.) so that future developers or stakeholders can understand the design trade-offs.
Incorporating these annotations or descriptions not only fosters better communication within your team but also creates a living document that evolves alongside your model. It ensures that the reasoning behind your design decisions remains transparent, making the model easier to troubleshoot and enhance over time. It creates a useful documentation you can come back to.
3. INFO.VIEW.COLUMNS(): Building a True Data Dictionary
INFO.VIEW.COLUMNS() is all about giving you the details of each column, its table, data type, and data category. It’s the foundation for building a real data dictionary within Power BI.


Why Column Info Matters
- Data Type Optimization: Ensure columns containing whole numbers only are set to ‘Integer’ and numeric or currency columns are set to ‘Number’ or Currency’ to minimize storage and maximize performance.
- IsAvailableInMDX: Control whether a column should be visible to MDX-based tools (e.g., Excel PivotTables, etc.). Hiding non-essential columns can boost performance and reduce confusion.
- Governance & Collaboration: Keep your team aligned by showing which columns are intended for reporting vs. internal calculations. Hide those columns that are not needed (for reporting)
- Ongoing Validation: Spot mismatch issues or find columns that are rarely used (and consider removing them).
[!TIP] Documenting column descriptions is a vital step for building an effective data dictionary. Detailed, well-crafted descriptions do more than label a column, they provide context. They explain the column’s role, and facilitate the use of the semantic model. A great help for self service developers!
Performance Tip
[!TIP] When you only need up to four digits for decimal, use Fixed Decimal Number (Currency) to reduce cardinality and streamline storage. It’s a small change but can have big performance payoffs in large models.
4. INFO.VIEW.RELATIONSHIPS(): Streamlining Complex Schemas


For large or complex models, the Model View can get cluttered fast. INFO.VIEW.RELATIONSHIPS() offers a straightforward, table-based overview of all relationships with useful information: cardinality, cross-filter direction, and whether referential integrity is relied upon.
Advantages
- Faster Analysis: Quickly see all relationship details in one place without clicking each connector in the diagram.
- Referential Integrity Check: If
RelyOnReferentialIntegrityisFalse, investigate to ensure no missing keys or data mismatches. - Audit & Governance: Export or visualize relationships directly in a Power BI report to share with stakeholders, making the data model more transparent.
All these documentation views are incredibly useful, but to truly leverage them, you need a strategy that combines the insights from these tables with additional DAX Query view and TMDL analyses.
The most effective approach to making Power BI documentation work for you is by integrating it into broader processes like CI/CD and code reviews (e.g. around pull requests processes, etc.) Documentation isn’t just about having well-organized tables, it’s about taking action on that information. Use these INFO views directly into your development workflow alongside the following:
- Run Best Practice Analyzers: Tools like Semantic Link Labs or Tabular Editor BPA or Dax Studio can automatically flag potential issues. These checks are designed to ensure that your model is not only performing well but is also maintainable and scalable in a production environment.
- Automate Model Health Checks: Incorporate scripts that generate
INFO.VIEW.*outputs at each deployment, helping you quickly identify and address deviations from your established standards. - Standardize Your Practices: Clearly define naming conventions, data type policies, and rules for measure placements to create a “gold standard” for your models.
[!TIP] Consider using Semantic Link Labs to aggregate INFO tables across all your semantic models into a unified metadata repository. This repository can show you how each table or column is used across reports, offering a comprehensive view of your model’s overall health.
By embedding this process into your development lifecycle, you ensure that your documentation remains accurate and actionable.
Conclusion
These INFO DAX Functions let your Power BI model document itself, revealing everything from measure definitions to column data types and relationship details, and all in a tabular, exportable format. When you integrate that insight into a robust review process, such as a code review, optimization exercise, you’re not just collecting data about your model, you’re proactively improving it.
If you need another reason to focus on this, the January 2025 OneLake Catalogue update might be it. Microsoft is expanding the Semantic Models details view to include table and column descriptions from Power BI Desktop.
This update helps data consumers quickly identify relevant tables and builds trust in the data. It is a great step forward in promoting data quality, confidence, and self-service.
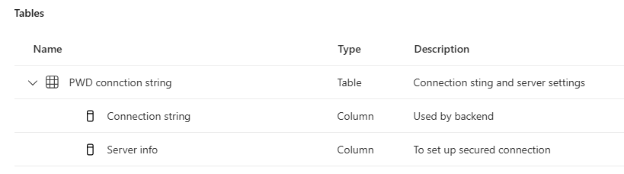
Source:
OneLake Catalog – Semantic model table & column description
The outputs from these INFO views can also be used to enhance the design document; future issue(s) will describe this and will include code snippets for easy use.
What’s your favorite part of the new INFO DAX Functions? Are you using them? Drop your thoughts in the LinkedIn post: We’d love to keep the discussion going!
LinkedIn post: # Issue 4 : 𝗔𝘂𝘁𝗼𝗺𝗮𝘁𝗲𝗱 𝗗𝗼𝗰𝘂𝗺𝗲𝗻𝘁𝗮𝘁𝗶𝗼𝗻 𝘄𝗶𝘁𝗵 𝗜𝗡𝗙𝗢 𝗗𝗔𝗫 𝗙𝘂𝗻𝗰𝘁𝗶𝗼𝗻𝘀 𝗶𝗻 PBI